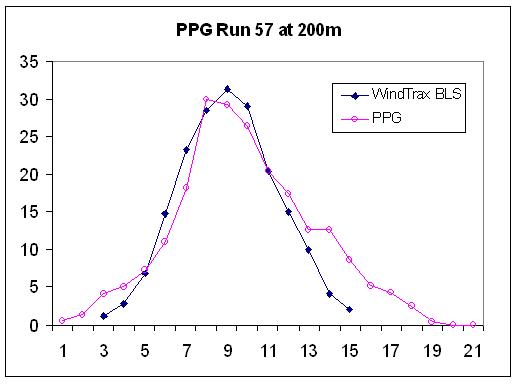
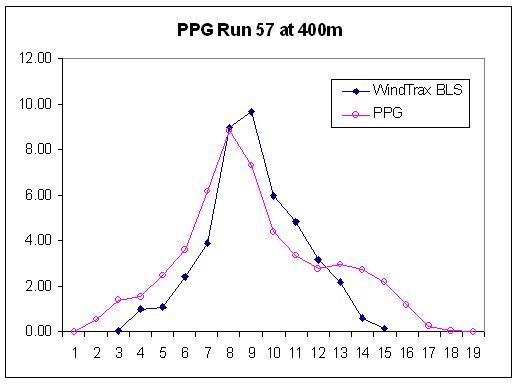
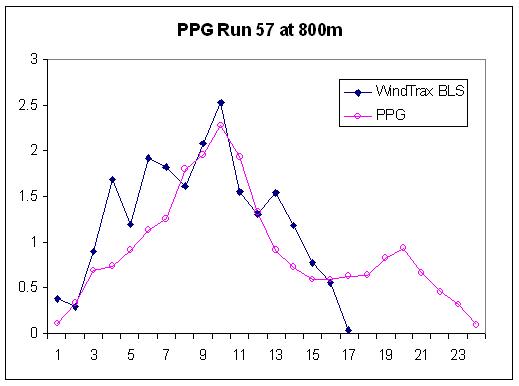
The following charts show a comparison of the concentration predicted by WindTrax downwind of a point source, using Project Prairie Grass Run 57 data. The source emitted SO2 gas at 101.5 g/s at a height of 0.46 m above a flat, mowed grass surface (Zo = 0.6 cm). Ten-minute samples were collected at 91 locations along semicircular arcs positioned 50m, 100m, 200m, 400m, and 800m downwind of the source. Stability for the experiment is estimated from wind and temperature profiles as L = -150m, with u* at 0.5 m/s. WindTrax results were similar whether the tracer release was modelled using either a point source or a small area source centered at the same location. Only the area source results, for which 2 million particles were released in order to improve "capture" of the source, are shown.
You can download both project files (WindTrax Version 2, .zip) here. Due to the large number of particles released and the 800m fetch, the area source project requires just over six hours to run on a 3.0 GHz machine; be warned that it also generates a 67 MB touchdown catalog file! It's clearly not practical to model distant point sources as tiny area sources using LS models; there's no reason to do so, either, except for testing purposes. The forward LS model, being more efficient at simulating point sources, releases one million particles and takes about three hours.